TL;DR
I build Soba, an iPhone app that estimates carbs from a meal photo, and I tested it on 400 photos from two public research datasets where the carbs in every meal were weighed or recorded. From one photo, 68.5% of estimates landed within 10 g of the actual carbs (median error 5.2 g), and 89% of meals under 15 g did. Large meals went the other way: in 38 of 42 meals with 60 g of carbs or more the estimate was too low, usually because Soba recognized the food and then judged the portion lighter than it was. A text hint or a depth-camera reading added about 4 points each, and of eight LLMs tested, the first-round winner only tied the production model on fresh data. Method and per-meal data are on the Soba accuracy page.
Why I ran this test
Carb counting is a daily chore for people with type 1 diabetes, because the insulin dose for a meal depends on how many grams of carbohydrate are in it. Soba shows results in grams and in bread units, and one bread unit is 10 to 12 g of carbs depending on the country, so a 10 g miss is roughly one unit. I wanted to know how often an AI estimate lands within 10 g of the truth.
Photo-based food apps rarely publish anything you could check. The best recent evidence is independent and not flattering. At NUTRITION 2026 in July, a team from the NIH’s diabetes institute (NIDDK) reported that four popular photo apps (MyFitnessPal, LoseIt!, CalAI and Appediet) undercounted meals by about 250 to 345 kcal on average, though carbs were the macro all four estimated most consistently. That work is a conference abstract and hasn’t been peer reviewed yet. The Diabettech blog sent 13 photos to four LLM APIs nearly 27,000 times and found estimates for a single paella photo ranging from 55 g to 484 g with Gemini 2.5 Pro.
Neither study covers my app. I’ve written before about how Soba’s recognition pipeline works in production: a Go backend, structured output through OpenRouter, a prompt that starts from scene scale. That article already pointed at portion weight as the weak spot, and this test measures how big the weakness is.
Two datasets, two kinds of photos
I needed photos where somebody had already measured the carbs, and two public datasets fit.
Nutrition5k comes from Google Research (CVPR 2021). Its plates were served in Google cafeterias, every ingredient was weighed, and a fixed camera shot each plate from straight above. It’s the clean case, with good light, a known camera height and weighed reference values. Soba scored 77.5% within 10 g on its 200 meals, with a median error of 3.9 g.
SNAPMe is a USDA and UC Davis study published in Nutrients in 2023. Ninety-five people in the US photographed their own meals before eating and logged them in ASA24, a dietary assessment tool. These photos look much more like the ones people take in the app, but the reference values come from self-reported food records, which carry errors of their own. Soba scored 59.5% within 10 g on 200 SNAPMe meals, median error 6.8 g. Part of that 18-point gap comes from the photos and part from the reference values, and this test can’t fully separate the two.
The selection was scripted. The starting pool was 505 Nutrition5k plates from the dataset’s official overhead test split and 1,457 SNAPMe photos taken before eating. Before that, 22 entries were removed: plates and meals with invalid values, and SNAPMe photos that couldn’t be matched to exactly one food record. A script with a fixed random seed drew 100 meals per dataset, 25 from each quarter of the carb range, so no part of the range ended up under-sampled by chance. Cafeteria plates shot within the same ten minutes often look nearly identical, so the script capped how many it took from any one ten-minute window. Then it drew a second, disjoint set of 200 the same way.
Drawing that second set turned out to be the most useful decision in the project. I studied errors and tried prompt changes only on the first 200 meals, and kept the second 200 for checking whether a result held up. Later it stopped me from switching models on noise.
Each photo was downscaled to 1,024 px on the long side, as the app does, and sent through the same server code with the same instructions, model and settings. Soba reports net carbs and fiber separately, while both datasets record total carbs, so the comparison used Soba’s net carbs plus fiber. All 400 scans succeeded, with a median of 3.1 seconds per photo.
The headline numbers
From one photo, with no hint and no correction afterwards:
- 68.5% of estimates within 10 g of the actual carbs (95% interval: 64.0% to 72.9%)
- 49% within 5 g
- median error 5.2 g
That overall figure hides a strong dependence on meal size:
| Actual carbs | Meals | Within 10 g | Within 20 g | Median error |
|---|---|---|---|---|
| Under 15 g | 167 | 88.6% | 98.8% | 2.0 g |
| 15 to 30 g | 94 | 69.1% | 88.3% | 6.2 g |
| 30 to 60 g | 97 | 54.6% | 84.5% | 8.4 g |
| 60 g or more | 42 | 19.0% | 38.1% | 25.4 g |
Of the test meals, 42% had under 15 g of carbs, which lifts the average. If your typical dinner is a big plate of pasta, the 68.5% headline doesn’t describe your experience, and the bottom row of the table comes much closer.
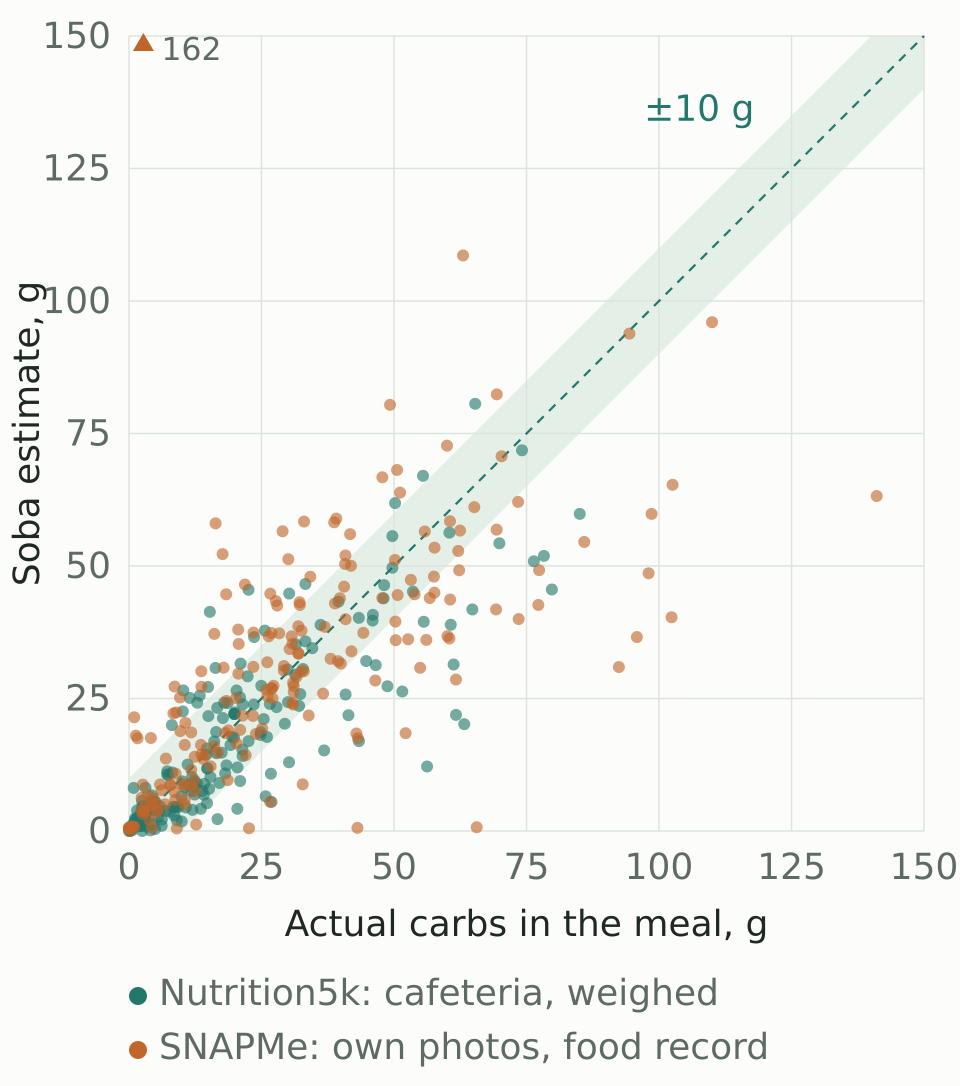
Every meal in the test. The shaded band is ±10 g. Points below the dashed line are underestimates. One drink, coffee with creamer read as caramel sauce, came out at 162 g and is pinned to the top edge.
Large meals: right food, wrong weight
In 38 of the 42 meals with 60 g of carbs or more, the estimate was too low, and the median estimate was 64% of the actual amount. When I went through those 38 one by one, the model had usually recognized the food correctly and got the carbs per 100 g roughly right, but misjudged the weight. In 30 of the 38, Soba judged the food to weigh at least 15% less than it did.
A typical case from Nutrition5k: four pieces of pizza with chicken, pineapple and cherry tomatoes. The pizza weighed 233 g; Soba said 180 g, and 85.1 g of carbs became 59.8 g. Of the 23 errors above 30 g in the whole test, 16 were in meals with 60 g of carbs or more.
Small single items failed in the opposite direction now and then. A slice of cheese pizza and a cookie came out at 46.6 g against an actual 33.3 g, because Soba put the pizza at 85 g (it was 47 g) and the cookie at 35 g (27 g). And sometimes errors cancel: on a plate of corn, rice, cauliflower and an apple, the apple was overestimated and the corn underestimated, and the total matched the reference to the tenth of a gram. A match like that looks good in a demo and says nothing about accuracy.
The user can’t see the actual carbs at scan time, so grouping errors by true meal size doesn’t help them decide when to trust a number. Grouped by Soba’s own estimate, 84 meals came out at 40 g or more, and 55 of them were off by more than 10 g: 32 too high and 23 too low. Above 40 g the estimate is unreliable in both directions, which is why the app now suggests weighing the main carb food once an estimate reaches 40 g.
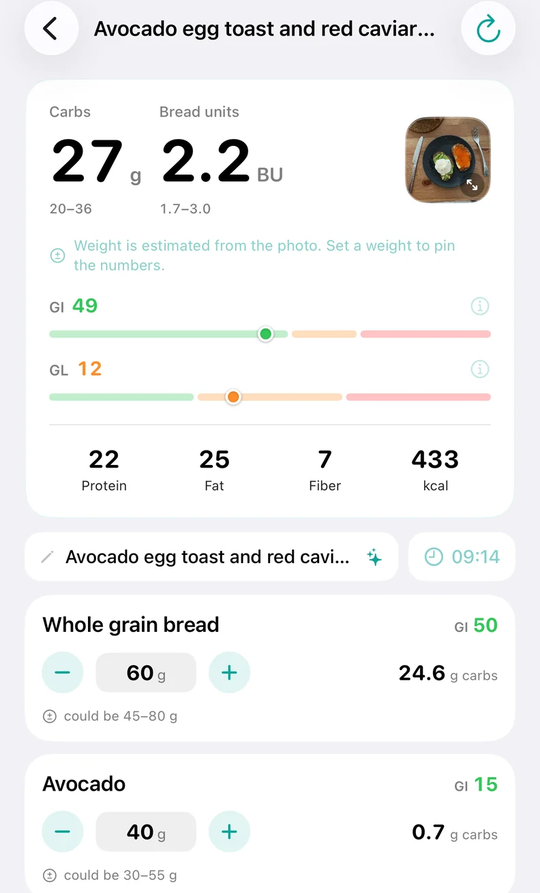
Soba also shows a weight range with each estimate, and I checked how often it holds. On the 200 weighed Nutrition5k plates, the real weight of the plate fell inside the range in 97 cases, about half, which is a weaker guarantee than the word “range” suggests. The range shows where the model expects the weight to be. A kitchen scale is still the only reliable check.
What a hint and a depth camera add
The main run used the photo alone. The app also accepts a few words of text, and on iPhones that have a LiDAR scanner or at least two rear cameras it measures the distance to the food. I reran the test with each.
A text hint. Each photo got a hint listing the main foods from the dataset’s record, with no amounts. It’s the same idea behind context engineering for agents: hand the model the one fact it can’t get on its own. The share within 10 g rose from 68.5% to 72.8% (95% interval for the gain: 0.7 to 7.9 points), and the median error fell from 5.2 to 4.5 g. The hint helped most where the photo could be read more than one way. Without it, Soba took a cup of coffee with fat-free creamer for caramel sauce and estimated 162 g of carbs. With “Coffee, brewed; Coffee creamer, liquid, fat free” it said 5.5 g, and the food record says 2.7 g. On SNAPMe’s home photos the share within 10 g went from 59.5% to 67.5%; on the cafeteria photos, where the food is easy to see, it barely moved (77.5% to 78.0%).
I’d discount the hint result, though. The test hints copied the dataset records word for word, which is better than anything a person types. And the gain was lopsided: 8.0 points on the first 200 meals, 0.5 on the second. A hint you type will probably add less. It also doesn’t fix the main failure, since large meals were still underestimated in 37 of 42 cases with a hint.
Distance from the depth camera. Nutrition5k ships a depth recording for every photo, so I could replay its 200 meals with the measurement added: the app tells the model how wide the frame is in centimeters. The share within 10 g rose from 77.5% to 82.0% (95% interval for the gain: 1.0 to 8.3 points), and the median error fell from 3.9 to 3.1 g. Large meals were still underestimated in 12 of 13 cases. These photos were all taken straight down from a fixed height, and I haven’t measured photos taken at an angle yet, which is how most people hold a phone. Depth plus hint scored 78.5%, and the interval for its difference from depth alone (−8.8 to +1.5 points) includes zero, so on these photos the hint added nothing measurable on top of depth.
Reproduce the numbers from the CSV
The per-meal results are public: 400 rows with the dataset ID, reference carbs, the photo-only estimate, the hint text, and the estimates with hint and with depth. This script needs only the Python standard library:
import csv
import io
import random
import statistics
import urllib.request

URL = "https://soba-app.com/accuracy/soba-carb-benchmark-2026-10.csv"
with urllib.request.urlopen(URL) as resp:
    rows = list(csv.DictReader(io.TextIOWrapper(resp, "utf-8")))


def errors(rows, col):
    return [float(r[col]) - float(r["reference_total_carbs_g"]) for r in rows if r[col]]


def summary(label, errs):
    abs_errs = [abs(e) for e in errs]
    w10 = sum(e <= 10 for e in abs_errs) / len(errs)
    w5 = sum(e <= 5 for e in abs_errs) / len(errs)
    print(f"{label:<28} n={len(errs):>3}  within10={w10:6.1%}  "
          f"within5={w5:6.1%}  median={statistics.median(abs_errs):4.1f} g  "
          f"mean={statistics.fmean(abs_errs):4.1f} g")


summary("photo only, all", errors(rows, "soba_total_carbs_g"))
summary("photo + hint, all", errors(rows, "soba_with_hint_g"))
for ds in ("nutrition5k", "snapme"):
    sub = [r for r in rows if r["dataset"] == ds]
    summary(f"photo only, {ds}", errors(sub, "soba_total_carbs_g"))
    summary(f"photo + hint, {ds}", errors(sub, "soba_with_hint_g"))
summary("photo + depth (n5k)", errors(rows, "soba_with_depth_g"))
summary("photo + depth + hint (n5k)", errors(rows, "soba_with_depth_and_hint_g"))

big = [r for r in rows if float(r["reference_total_carbs_g"]) >= 60]
under = sum(float(r["soba_total_carbs_g"]) < float(r["reference_total_carbs_g"]) for r in big)
ratio = statistics.median(
    float(r["soba_total_carbs_g"]) / float(r["reference_total_carbs_g"]) for r in big)
print(f"\nmeals >= 60 g: {len(big)}, underestimated: {under}, median estimate/actual: {ratio:.0%}")

flagged = [r for r in rows if float(r["soba_total_carbs_g"]) >= 40]
high = sum(float(r["error_g"]) > 10 for r in flagged)
low = sum(float(r["error_g"]) < -10 for r in flagged)
print(f"estimates >= 40 g: {len(flagged)}, >10 g too high: {high}, >10 g too low: {low}")

# Naive bootstrap over single meals. The published interval resamples whole
# clusters instead: one SNAPMe participant or one 10-minute cafeteria window.
random.seed(0)
hits = [abs(e) <= 10 for e in errors(rows, "soba_total_carbs_g")]
boots = sorted(statistics.fmean(random.choices(hits, k=len(hits))) for _ in range(10_000))
print(f"within10 95% CI (naive bootstrap): {boots[250]:.1%} to {boots[9750]:.1%}")
Running it while writing this post printed:
photo only, all              n=400  within10= 68.5%  within5= 49.2%  median= 5.2 g  mean= 9.5 g
photo + hint, all            n=400  within10= 72.8%  within5= 53.0%  median= 4.5 g  mean= 8.3 g
photo only, nutrition5k      n=200  within10= 77.5%  within5= 57.5%  median= 4.0 g  mean= 6.8 g
photo + hint, nutrition5k    n=200  within10= 78.0%  within5= 60.0%  median= 3.7 g  mean= 6.5 g
photo only, snapme           n=200  within10= 59.5%  within5= 41.0%  median= 6.8 g  mean=12.2 g
photo + hint, snapme         n=200  within10= 67.5%  within5= 46.0%  median= 5.6 g  mean=10.2 g
photo + depth (n5k)          n=200  within10= 82.0%  within5= 61.5%  median= 3.1 g  mean= 6.2 g
photo + depth + hint (n5k)   n=200  within10= 78.5%  within5= 63.0%  median= 3.4 g  mean= 6.3 g

meals >= 60 g: 43, underestimated: 38, median estimate/actual: 65%
estimates >= 40 g: 84, >10 g too high: 32, >10 g too low: 23
within10 95% CI (naive bootstrap): 63.7% to 73.0%
A few small mismatches with the accuracy page come from rounding. The CSV stores grams to one decimal, so a meal recorded at, say, 59.96 g lands in the CSV as 60.0 g and crosses a bucket edge: 43 large meals here against 42 on the page, and 65% against 64%. The Nutrition5k median sits exactly between 3.9 and 4.0 in the rounded file. The interval is a separate matter of method: my naive bootstrap gives 63.7% to 73.0%, close to the published 64.0% to 72.9%. The published method keeps meals from one SNAPMe participant or one cafeteria time window together when it resamples, which is the safer choice when photos within a cluster resemble each other. On this data it barely moves the interval.
Eight models, same instructions
Before settling on the production model, I ran eight models on the first 200 meals with Soba’s prompt, one run each through OpenRouter, using the request settings Soba had before October 2026:
| Model | Within 10 g | Median time |
|---|---|---|
| Google Gemini 3.7 Flash | 73.0% | 3.7 s |
| Google Gemini 3.8 Flash | 71.5% | 4.8 s |
| Google Gemini 3.5 Flash-Lite | 69.0% | 2.1 s |
| Google Gemini 3.6 Flash (production) | 67.5% | 3.3 s |
| OpenAI GPT-6 Luna | 65.0% | 6.9 s |
| OpenAI GPT-6 Luna Pro | 63.0% | 11.7 s |
| OpenAI GPT-6.1 Sol | 58.0% | 13.1 s |
| Anthropic Claude Sonnet 5.5 | 53.0% | 6.0 s |
The Gemini Flash tier swept the top four places and was faster than every other model in the lineup. OpenAI’s two slower models scored below GPT-6 Luna, and GPT-6.1 Sol overestimated carbs by 10 g on average. Claude Sonnet 5.5’s last place has an asterisk: through the provider OpenRouter routed it to, it returned an empty food item for 41 of the 200 photos. On the other 159 it reached 66.7%, right in the pack. A harness that drops empty answers instead of counting them as misses would never have shown this.
Gemini 3.7 Flash won the round by 5.5 points over production. When one model out of eight comes first, some of that lead is luck, so I ran both on the second 200 meals, which neither the prompt work nor the model comparison had touched. There they tied at 70.5% each, and 3.7 Flash costs more. Soba stays on Gemini 3.6 Flash. Without the holdout set I would have switched models on what was mostly noise.
I also tried letting Gemini 3.6 Flash reason longer. Over all 400 meals the share within 10 g went up 4.1 points, but the share within 5 g and the count of errors above 30 g didn’t change, while each scan took twice as long (6.6 seconds against 3.5). Extra reasoning nudged medium errors under the threshold and did nothing about the large ones, which are the ones that hurt. I kept the faster setting.
I doubt the coding benchmarks I relied on when comparing Gemini Flash with Claude Haiku would have predicted this order, which is why the comparison ran Soba’s own prompt on real meal photos. The latencies here come from this one-run comparison through OpenRouter, so they differ a little from the 3.1-second median of the main run.
How this compares with published studies
The closest published comparison is Rodríguez-Jiménez and colleagues in Nutrients (2025), who tested ChatGPT-5 on 74 SNAPMe meals from photos alone. They report a mean absolute carb error of 12.99 g and a median of 8.75 g. On its 200 SNAPMe meals, Soba’s photo-only numbers were 12.2 g and 6.8 g. The authors picked their meals differently and corrected some reference values by hand, so this is a rough comparison at best: it says the two sit at a similar level of error. In their study a short note about the meal’s fat, sugar and meat brought ChatGPT-5’s mean error down to 11.29 g; in mine, a hint naming the foods lowered it from 12.2 to 10.2 g on the same dataset.
A 2026 study in the Journal of Diabetes Science and Technology used the same ±10 g threshold to evaluate ChatGPT-4o as a carb-counting aid for adolescents with type 1 diabetes. It found 93.3% of fruit and vegetable estimates within that range but only 46.7% of composite meals. The photos and the model generation differ, but the pattern is the same: single foods scored well and mixed plates didn’t.
The NIDDK abstract’s headline, apps undercounting calories by a few hundred kcal per meal, is mostly about fat, which this test didn’t measure; carbs were the macro those four apps handled most consistently. Soba’s carb errors had a narrower shape: a strong underestimate on meals with 60 g or more, and misses in both directions once the estimate itself passed 40 g.
Two bugs the test found
Running 3,614 requests through production code shook out two bugs that normal use hadn’t.
First, the backup model from OpenAI couldn’t run. Soba sent a temperature setting that the OpenAI backup didn’t accept. The request also allowed only providers that support every parameter in it (on OpenRouter, the require_parameters provider option), so the fallback had no provider to run on and would have failed on every scan if Gemini had gone down. I removed the setting. The main model scored 68.9% with it and 68.5% without, inside the normal run-to-run variation. Gemini 3.7 Flash and GPT-6 Luna are the backups now. If you use a failover model array like the one in my production write-up, send test traffic to each fallback on its own, because an untested failover may not work when you need it.
Second, in 9 of the 3,614 requests (0.25%), Gemini got stuck repeating one phrase and the scan took 35 to 87 seconds. A cap on answer length now stops those loops much earlier.
Limits
All meals come from the US. Nutrition5k was shot from straight overhead with one fixed camera setup, which no app user would reproduce. The reference values have errors: SNAPMe’s come from self-reported records, and some Nutrition5k labels miss food that’s visible on the plate. I only tested photo recognition, so text descriptions, barcodes and manual entry were outside the test, and I only measured carbs, so protein, fat and calories aren’t covered. The test hints copied the dataset records exactly. The depth result covers only the 200 overhead Nutrition5k photos. The run used the app’s Russian language setting. And model providers update their models, so all of this describes Soba in October 2026.
What this means if you count carbs
Soba isn’t a medical device, and none of these numbers replace your diabetes care plan. The practical reading of the data:
- For a big plate of bread, rice, pasta, potatoes or pizza, weigh the main carb food if you can. Above 40 g the estimates missed by more than 10 g in either direction about two times out of three.
- Small single items such as a cookie or a slice of pizza sometimes come out heavier than they are.
- Sugar dissolved in a drink is invisible. In the test, a sweetened iced tea with 65.6 g of carbs was read as unsweetened (0.7 g), and even a hint saying it was pre-sweetened only lifted the estimate to 28.0 g. A hint like “sweet tea” helps, but for bottled drinks the barcode or the label is the reliable route.
- For packaged food, the barcode gives you the label values, which beat any photo estimate.
What this means if you build with vision LLMs
Most of what I learned applies to any feature where a multimodal model estimates a quantity:
- Keep a holdout set and don’t look at it while you tune. Mine stopped a model switch that the first-round numbers made look obvious.
- Break the results down by the size of what you’re estimating. The 68.5% average hid a 19% result on meals with 60 g of carbs or more, and that row changes how people should use the app.
- Count failures as misses. Claude’s 41 empty answers would have vanished from an average that skipped them.
- Find the bottleneck before you shop for models. Here it was portion weight on large plates. Depth data and a weight editor in the UI go after that directly. A hint doesn’t, since it names foods without amounts, and even depth left 12 of 13 large meals underestimated.
- Bootstrap by cluster when your samples come in clumps. Photos from one participant or one ten-minute window aren’t independent, so resample them together. Here it barely changed the interval, but you only find that out by doing it.
FAQ
How accurate are AI photo carb counters?
In this test of Soba on 400 research photos, 68.5% of photo-only estimates were within 10 g of the measured carbs, and the median error was 5.2 g. Accuracy depends heavily on meal size: 89% of meals under 15 g were within 10 g, but only 19% of meals with 60 g or more. Other studies point the same way on meal complexity: a ChatGPT-4o study found mixed meals far harder than single fruits and vegetables, and a ChatGPT-5 study reported larger carb errors on higher-carb meals.
Can ChatGPT count carbs from a picture?
It can produce an estimate. A 2025 study of ChatGPT-5 on 74 SNAPMe meal photos reported a mean carb error of 12.99 g and a median of 8.75 g, and a 2026 study of ChatGPT-4o found 46.7% of composite meals within 10 g. In my model comparison, OpenAI’s three GPT-6-generation models scored 58–65% within 10 g on 200 meals with Soba’s prompt, behind all four Gemini Flash models.
Is AI carb counting accurate enough for insulin dosing?
Not on its own for large meals. Errors under 10 g were common for small and medium meals, but when Soba’s estimate was 40 g or more, about two in three of those estimates were off by over 10 g. Weighing the main carb food, scanning barcodes for packaged items and following your diabetes care plan remain the reliable checks.
Does LiDAR or a depth camera improve AI food estimates?
In this test it did. Adding the measured distance to the food raised the share within 10 g from 77.5% to 82.0% on 200 overhead cafeteria photos. Large meals were still underestimated in 12 of 13 cases, and photos taken at an angle haven’t been measured yet.
Which AI model is most accurate at estimating carbs from photos?
On the first 200 meals, Gemini 3.7 Flash scored highest at 73.0% within 10 g, but on a second, untouched set of 200 it tied Gemini 3.6 Flash at 70.5%. The Gemini Flash models led OpenAI’s GPT-6 family and Claude Sonnet 5.5 on this task, as of October 2026.
Sources
- Soba accuracy test, October 2026: the full method, results and limits this post is based on
- Per-meal results CSV: 400 rows, CC BY-SA 4.0
- Nutrition5k: Towards Automatic Nutritional Understanding of Generic Food (Thames et al., CVPR 2021) and the dataset on GitHub, CC BY 4.0
- SNAPMe: A Benchmark Dataset of Food Photos for Dietary Assessment (Larke et al., Nutrients 2023) and the data on USDA Ag Data Commons, CC BY-SA 4.0
- Rodríguez-Jiménez et al., Image-Based Dietary Energy and Macronutrients Estimation with ChatGPT-5 (Nutrients 2025): the ChatGPT-5 comparison
- Evaluating Accuracy of ChatGPT-4o in Automated Carbohydrate Estimation From Images (J Diabetes Sci Technol, 2026): the ±10 g study of ChatGPT-4o as a carb-counting aid for adolescents with type 1 diabetes
- American Society for Nutrition release on photo-based calorie apps (NUTRITION 2026): the NIDDK abstract on four apps, not yet peer reviewed
- Diabettech: I asked AI to count my carbs 27,000 times: reproducibility of LLM carb estimates across repeated queries
- OpenRouter provider routing docs: what
require_parametersdoes
Bottom line
A photo gets you within 10 g most of the time for small and medium meals, and it does that in about three seconds, faster than looking every food up in a database. Above about 40 g, treat the estimate as a starting point to check, because the model recognizes the food and then misjudges how much of it there is. I’d rather say that plainly and point people to a kitchen scale than lean on the 68.5% average. The method, misses and per-meal data are all public, and I’ll rerun the test when the model or the prompt changes.